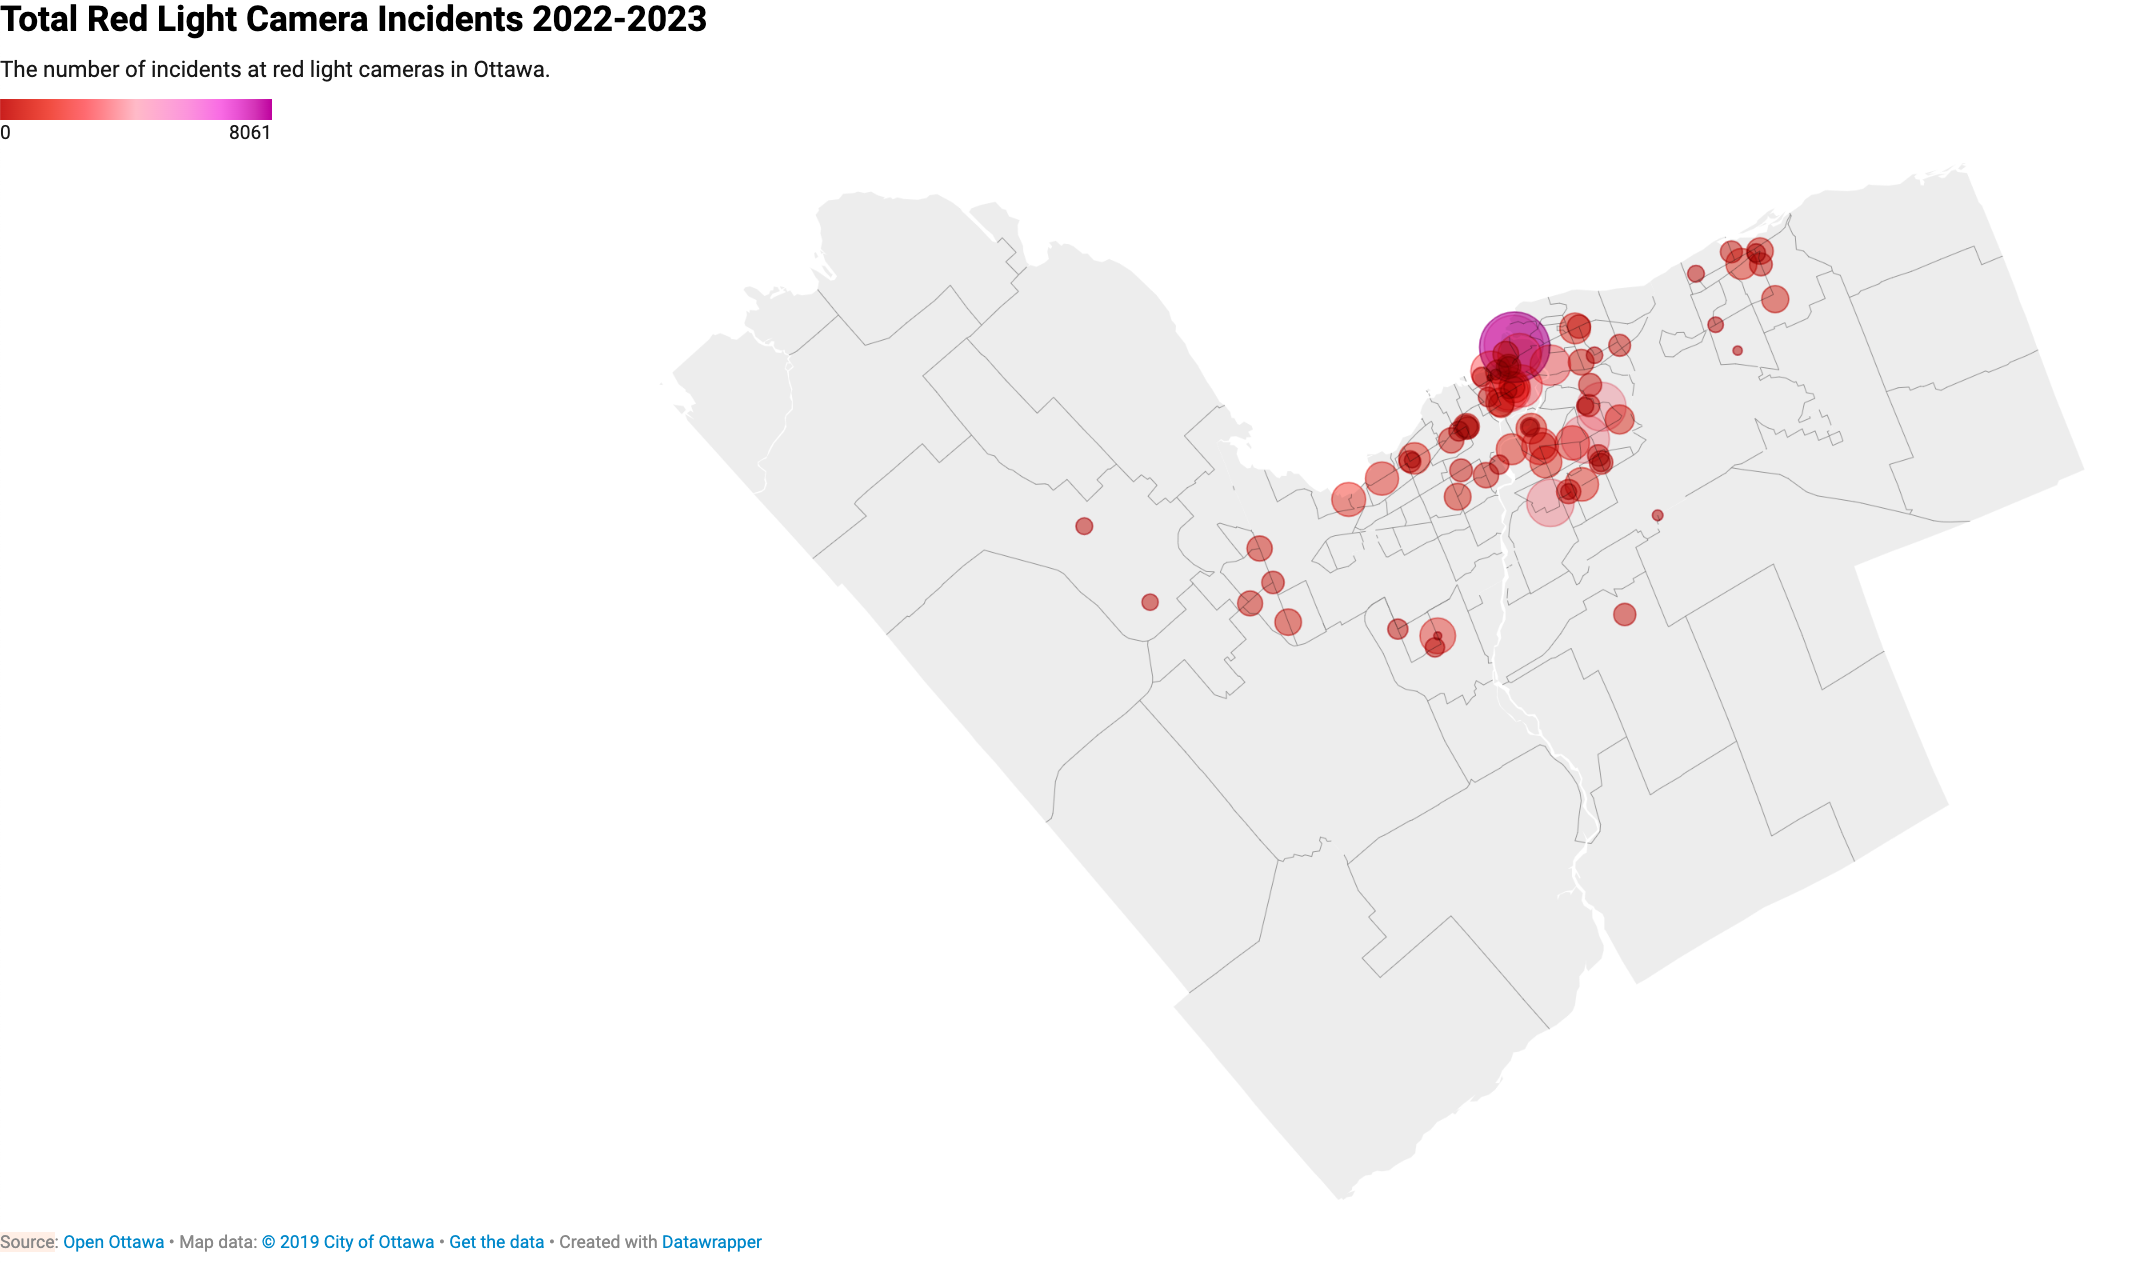
Figure 1: Datawrapper map of concentrated Red Light Camera Incidents from 2022-23
Live LinkWritten by Kim Huang, Lena El Haddad, Sarah Klassen
This paper will analyze data taken from the Open source portal of the City of Ottawa using the Red Light Camera Violation Data sets taken from the year 2022 and 2023
Between 2022 and 2023 in Ottawa, Ontario, the instances in which red light cameras have captured cars running red lights have shifted both negatively and positively. In only nine months during the present year, 2023, Ottawa faced the issue of having to charge a total of fourteen million dollars in red light tickets (Pringle, 2023).
Our data set represents the total recorded violations, as in cars that have run a red light, at the same intersections between two separate years and compares the effective and ineffective impact of red light cameras in Ottawa, Ontario. From this, we will be focusing on the process of cleaning, understanding, and collecting a relevant story that can be retrieved from our analysis of the red light camera violations in Ottawa between both years. Our hypothesis lies in uncovering highlighted areas that require more city intervention, traffic improvements, and potential safety concerns.
2022 Dataset Live Link 2023 Dataset Live LinkThis section will explain the methods taken in order to retrieve, clean, and organize our dataset into visualizations.
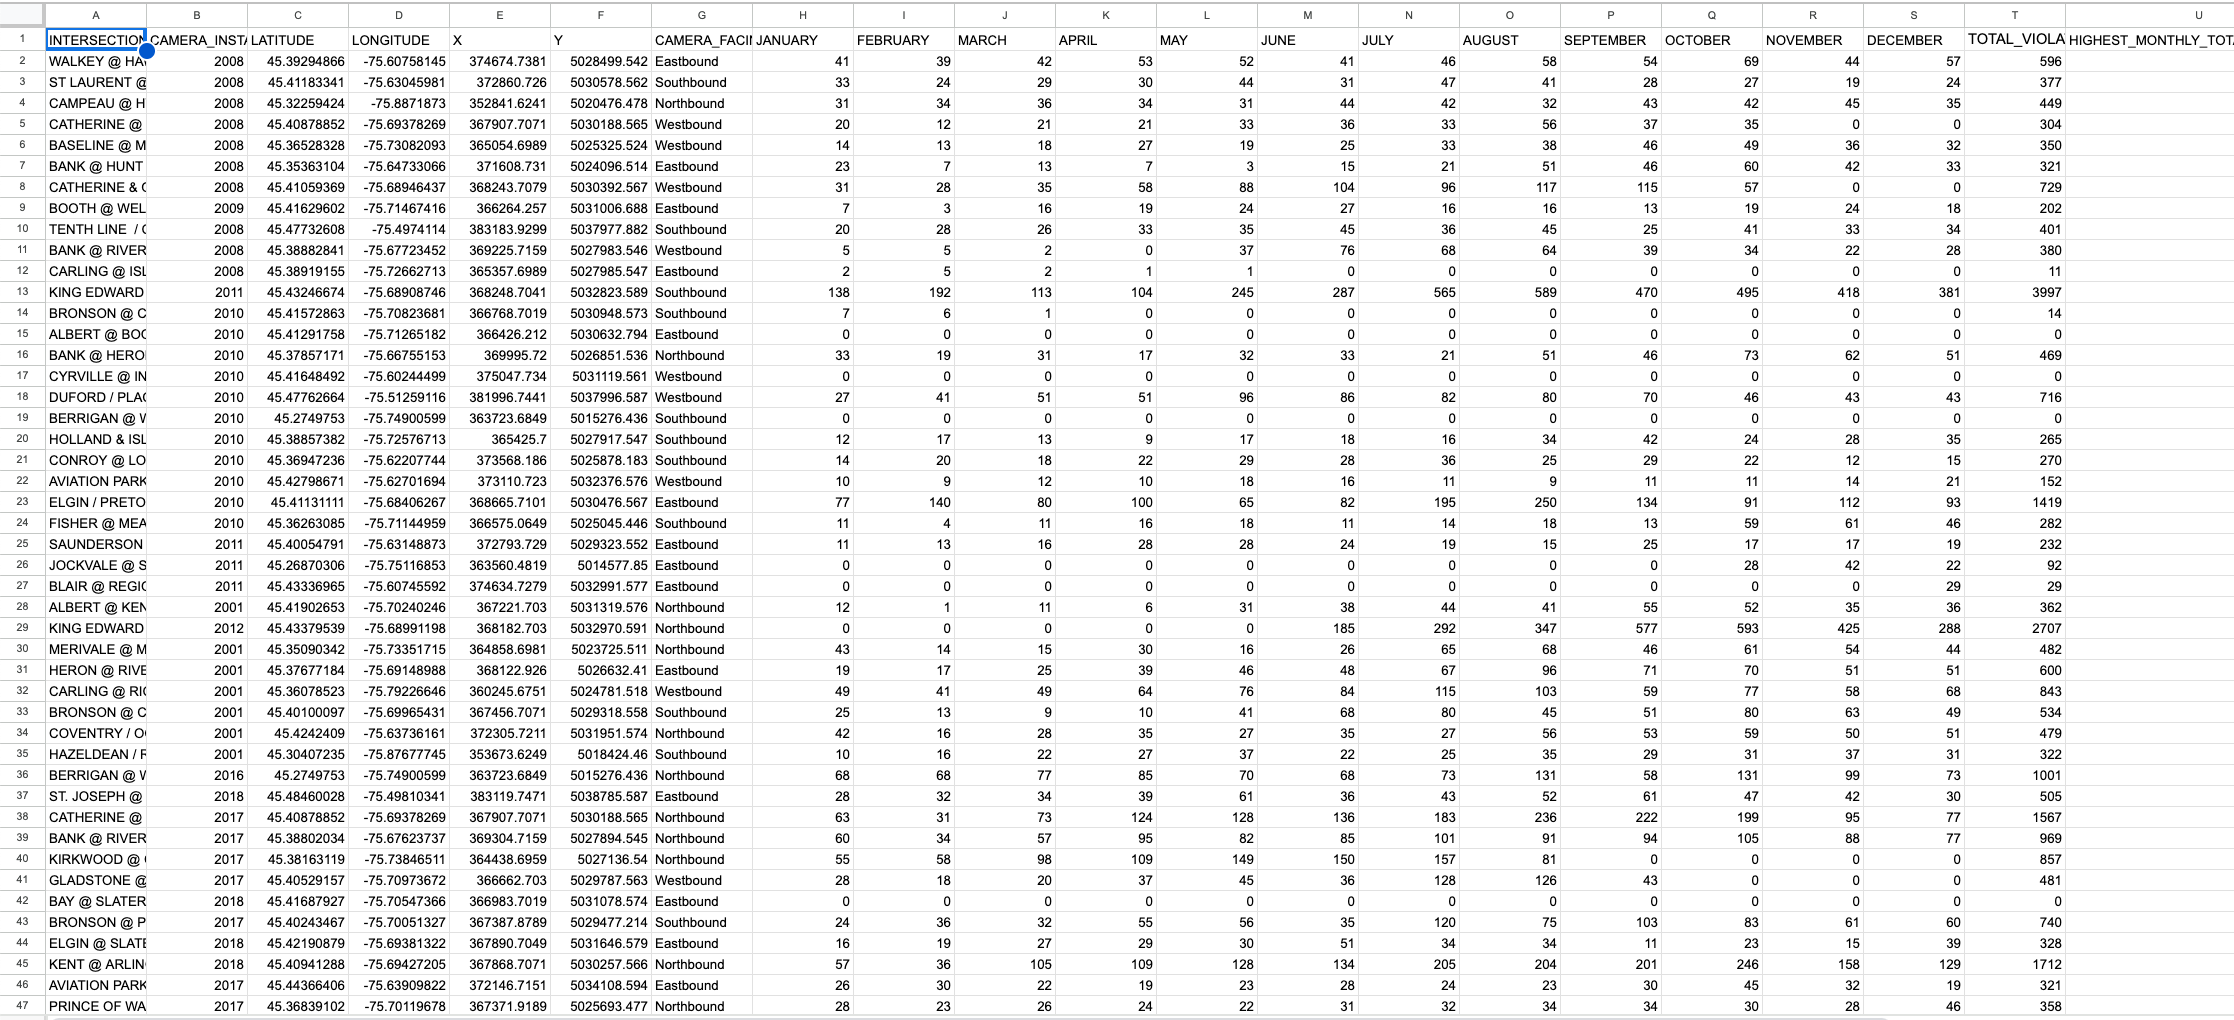
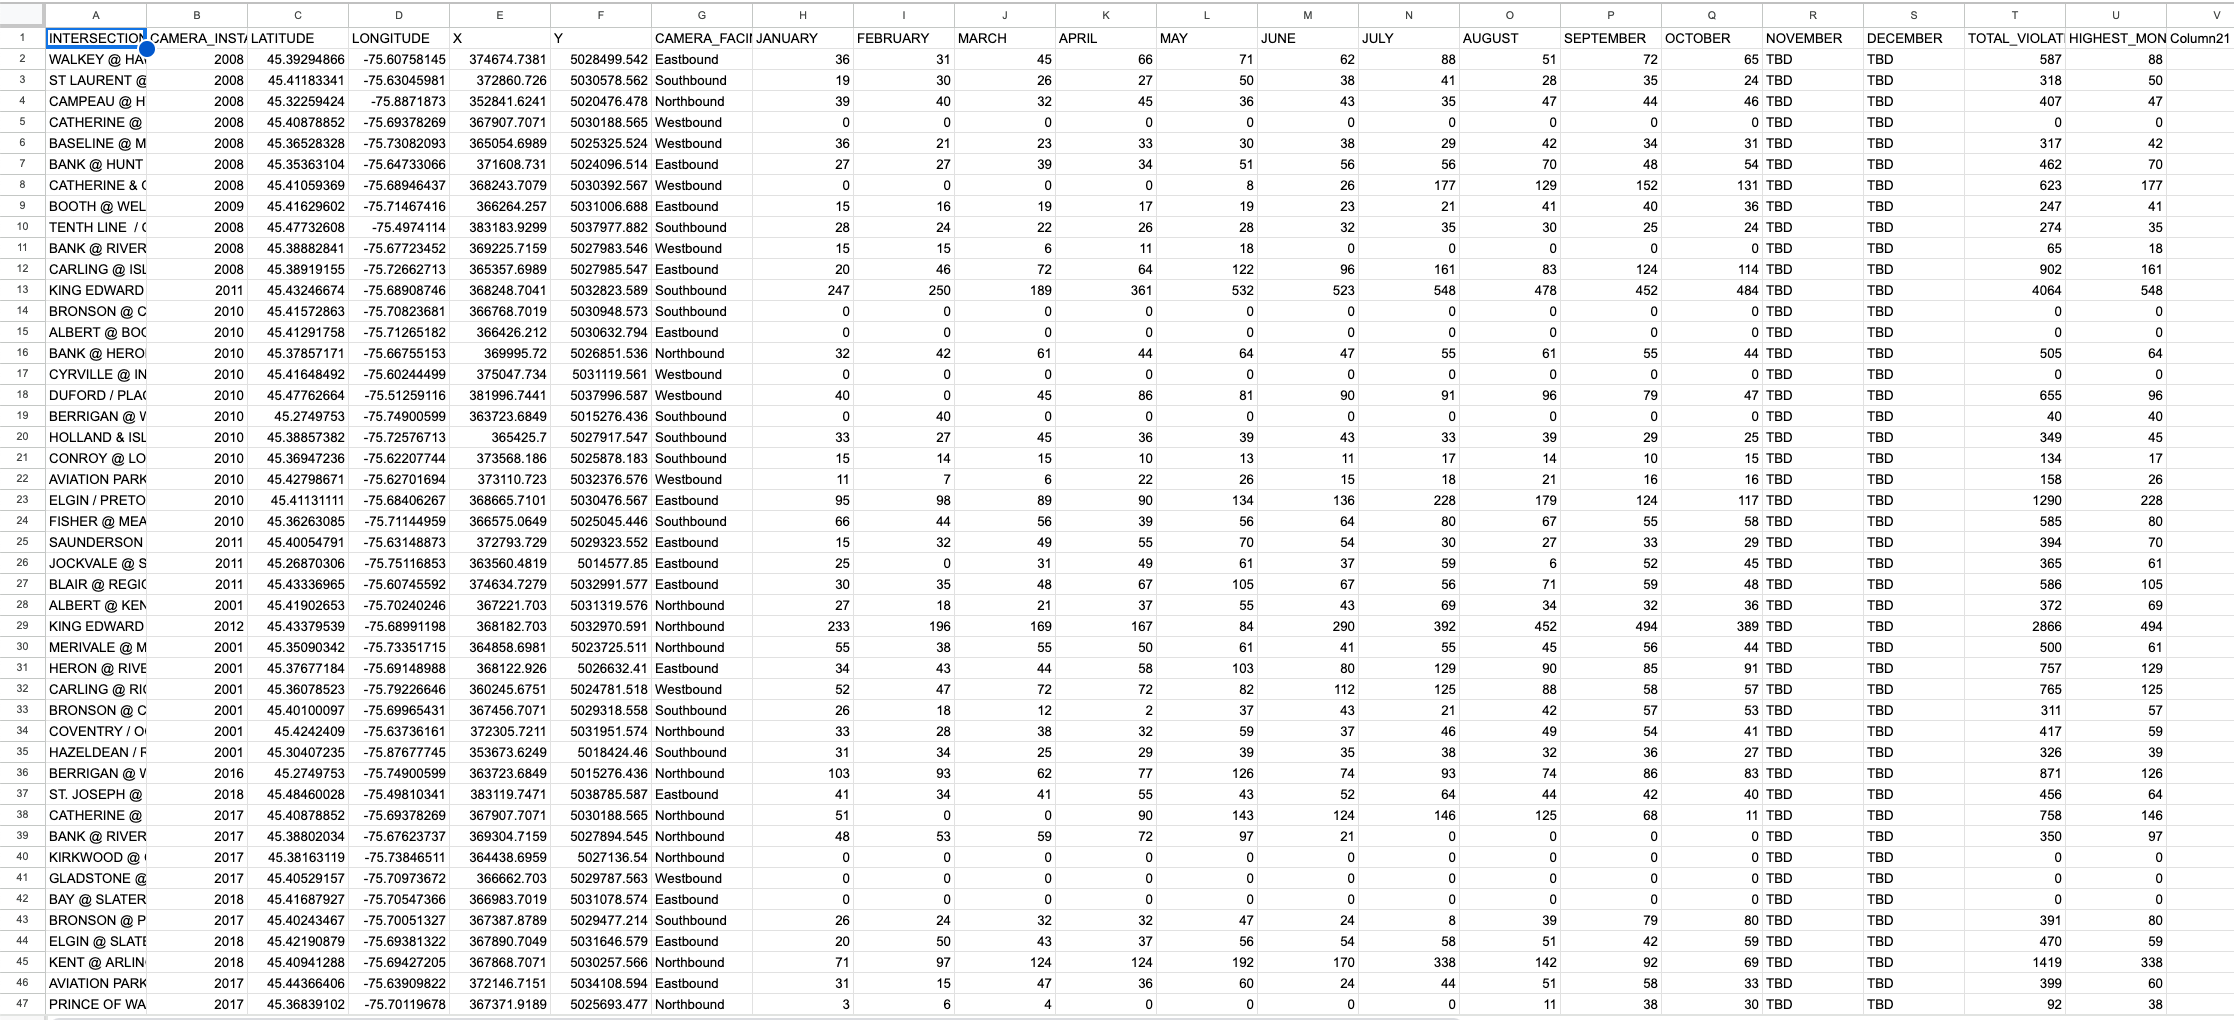
“Online Databases, Registries, & Open Data Portals” was the spreadsheet utilized to retrieve our open data source, whereas our chosen dataset was collected from row 49, “the City of Ottawa.” In the transportation section of the site, the two datasets labelled “Red Light Camera Violations 2022” and “Red Light Camera Violations 2023” were then downloaded as CSV files to be imported into a Google Spreadsheet. By creating a new spreadsheet document, naming the file “Red Light Camera Violations 2022-2023”, and using the ‘+’ on the bottom left corner to create a new tab, we will then click on File, Import, and our CSV to upload our files into their own corresponding tabs. The first is "Red_Light_Camera_Violations_2022,” and the second is "Red_Light_Camera_Violations_2023."
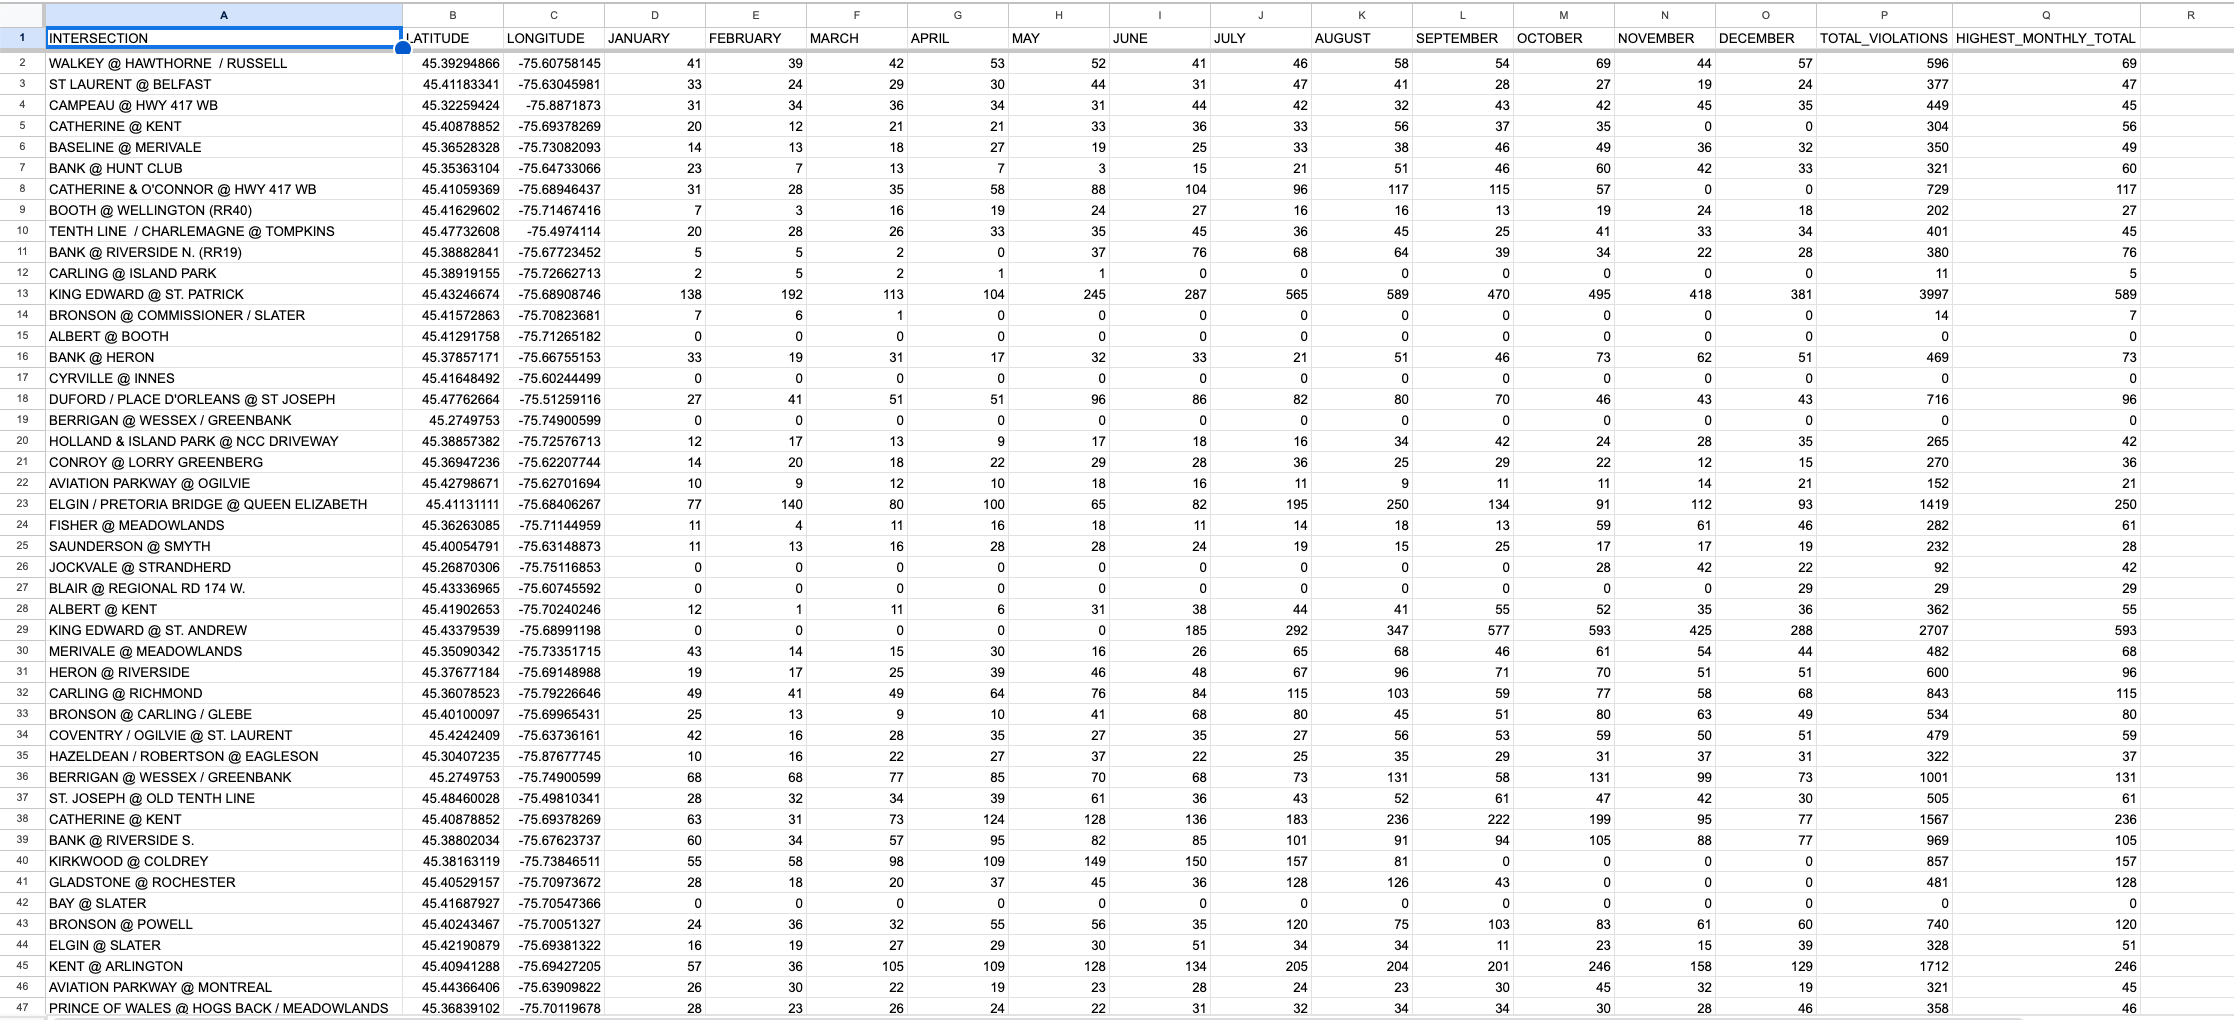
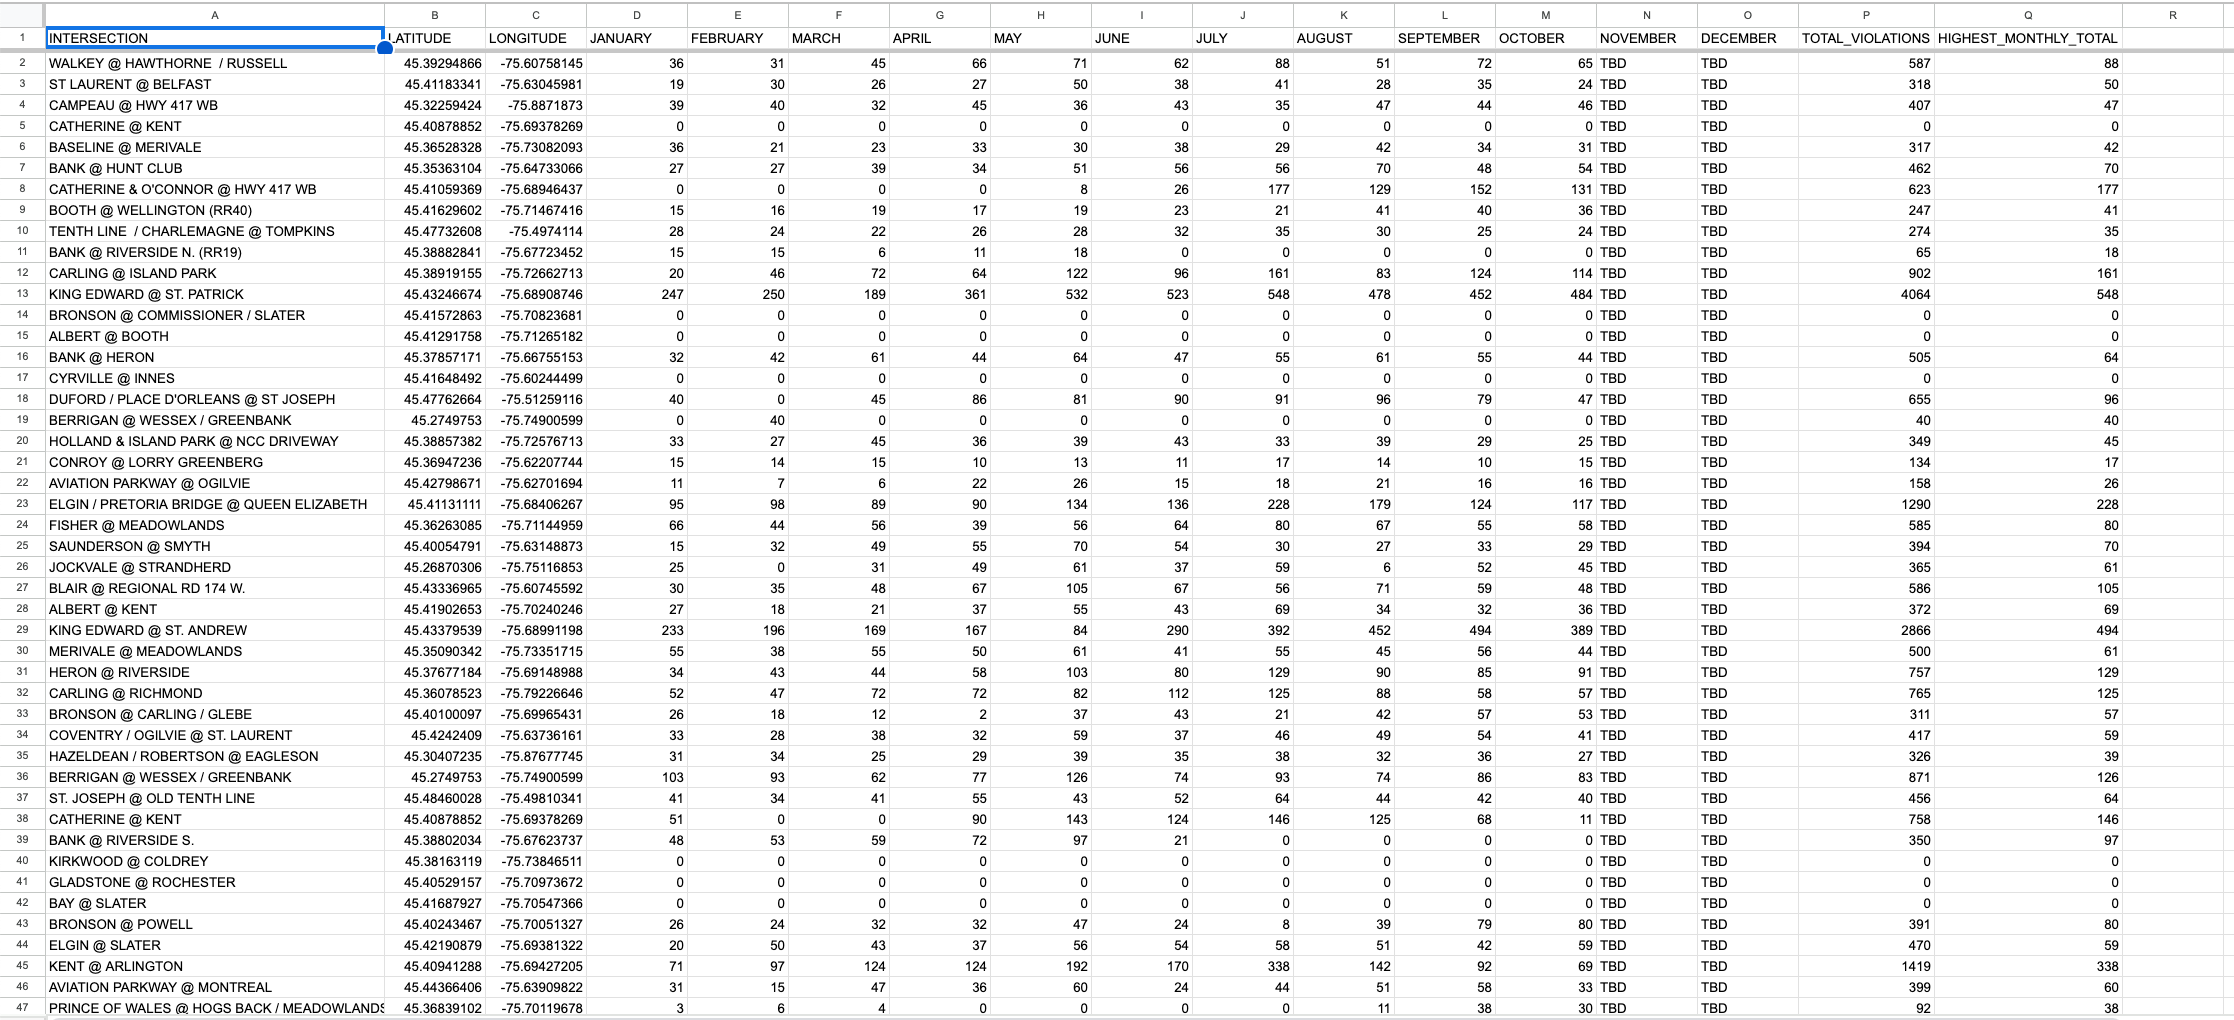
The cleaning of our dataset was done through Google Spreadsheets. From an initial observation, the dataset was relatively clean when imported into the document. Before cleaning the data, there were 85 rows (excluding the headers) and 22 columns in both datasets for 2022 and 2023. Column A contained the "Intersections"; Column B defined the "Camera Install Years", C was the "Latitude", D was the "Longitude", E was for the "X-axis", F was for the "Y-axis", G was for "Camera-Facing", H-S recorded the months from January to December, while T recorded the "Total Violations", U the "Highest Monthly Total", and V the "FID". We concluded that columns B and G were not necessary in order to measure our data and so the "Camera Install Years" and "Camera-Facing" columns were promptly deleted. Afterwards, it was discussed that Columns E and F for the X-axis and Y-axis were also not needed as we had already provided the "longitude" and "latitude," so a total of 4 columns were deleted from our data set. Leaving only 18 columns in both the datasets of 2022 and 2023. To make our charts more legible, we also froze the first row for each of our cleaned datasets.
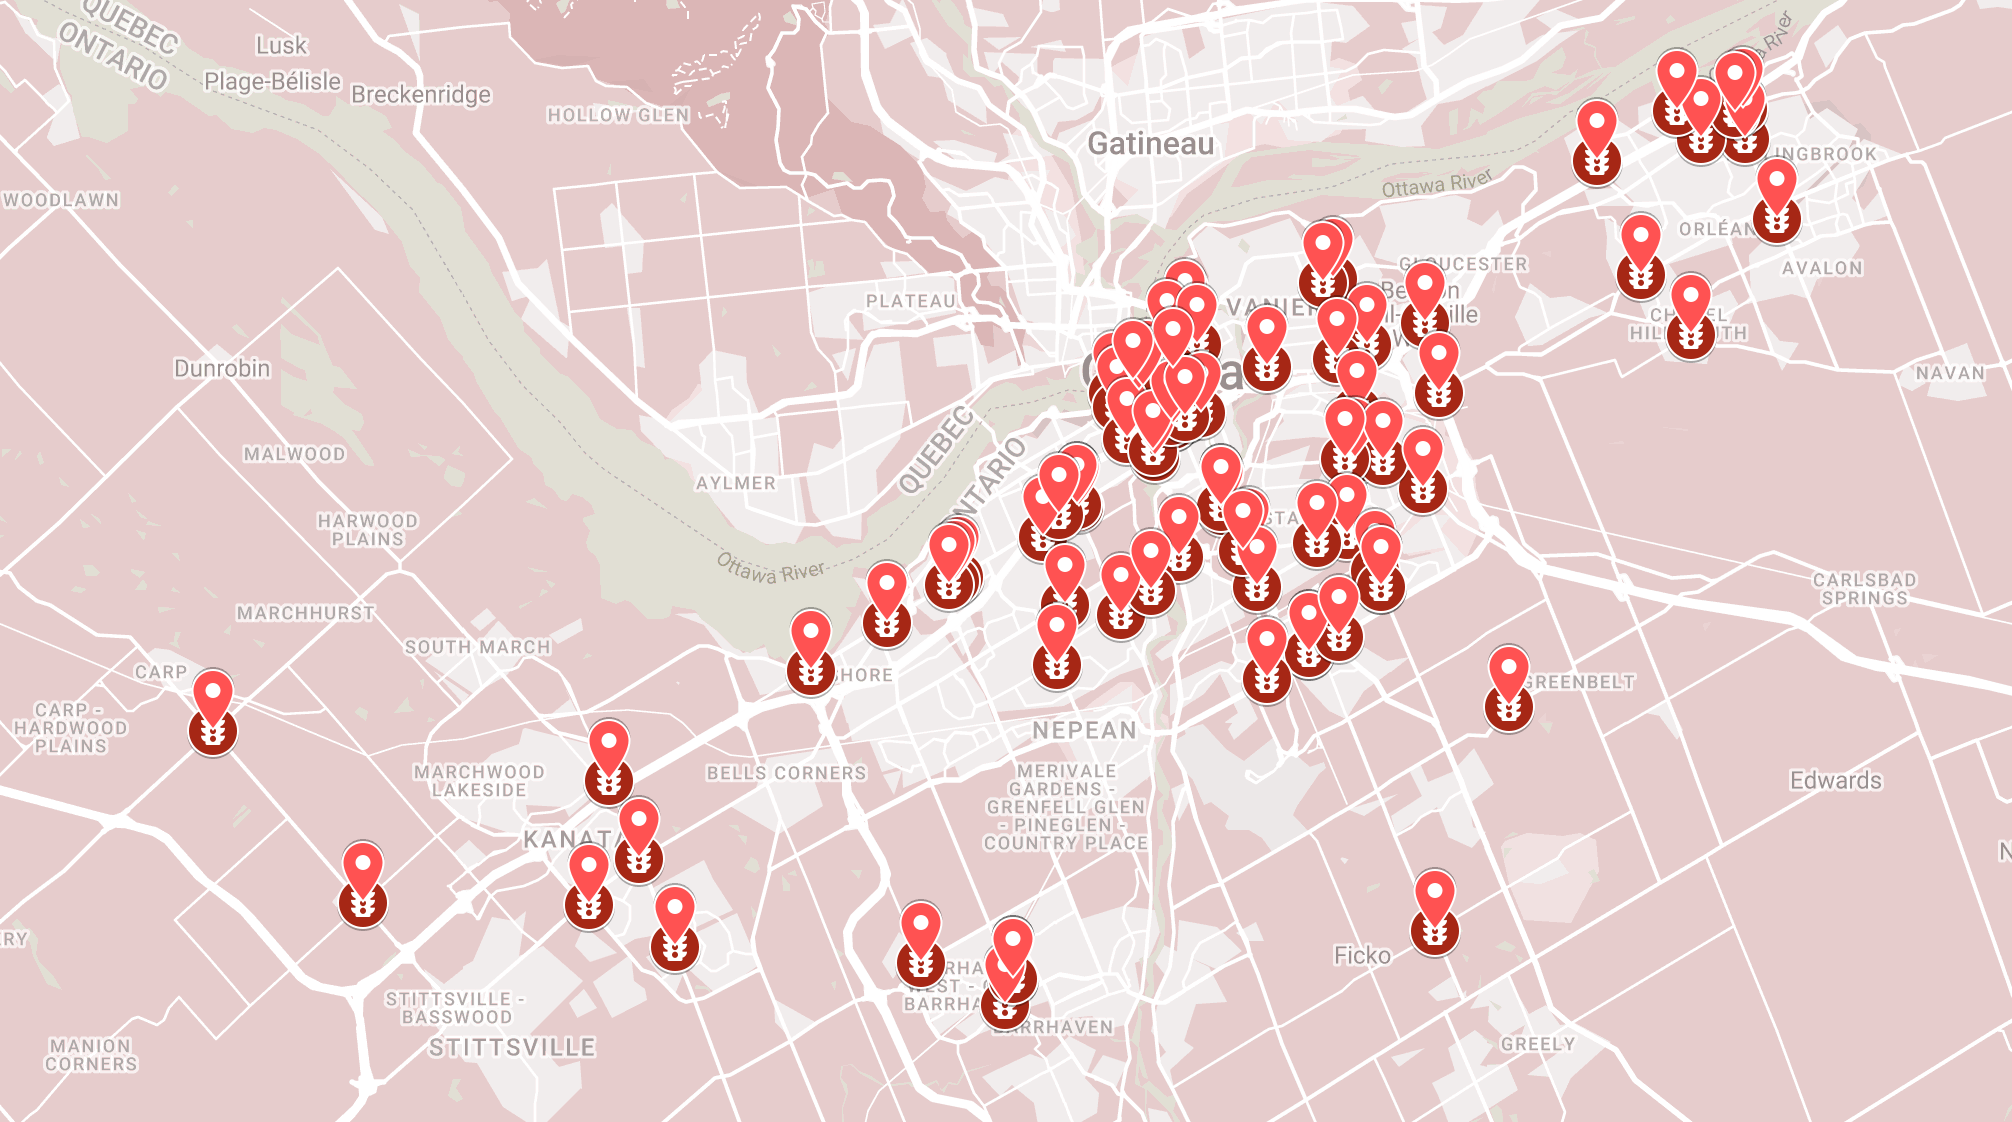
Datawrapper and Google My Maps were used in order to organize the collected data. Using Google My Maps, with our cleaned dataset, we imported both datasets from 2022 and 2023 into a new layer by selecting “add layer” and "import." From there, we adjusted the uniform style and icons to our liking. In preparation for our second chart, we created a new tab called “Sheet 2” in order to collect and compare the "Total Violations" of both the 2022 and 2023 data in one document sheet. From this, the “=SUM(B2+C2)” function was used and dragged downwards in order to collect the total of both datasets overall and fill up the empty rows up until row 86. This sheet was used to create the data visualization created in DataWrapper. In addition, using “Sheet 2," we created a pivot table in preparation for our third visualization chart. Pivot tables can be created by using CTRL+A to select all the data from the dataset and clicking Insert and Pivot Table. And so, by selecting the columns created in Sheet 2, a pivot table was created and then imported into Datawrapper. Our selection of utilizing maps and the bullet bar chart was for both aesthetic and beauty reasons as well as functionality reasons. This would be optimal for easy interpretation when aiming to compare two separate datasets together.
Although there have been more decreases in running red lights than increases, the total number of running red light incidents has grown. From our symbol map, one can make the simple observation of how the top two intersections with the highest number of incidents are on the same street, King Edward. From this information, we can see that there is possibly an issue with this specific street, which poses interesting questions regarding it, such as whether the green lights are potentially too short? Are the red lights too long for a given direction? What is motivating people to consistently run these red lights? These questions would only be able to be answered if we had access to other data and information relevant to the topic. Still, we can suggest one clear thing from this data: these areas are much more common for red light running, so drivers and pedestrians should take more caution when at these intersections.
We interviewed three subjects about this case: Shawn Payne and Jordan DeWever, who are both young drivers and Bahaa El Sarraf, who is an adult driver who tends to a job every weekday. We asked them if they had ever run a red light before, and all three answered yes. “It’s not something I do super often, but I especially avoid running red lights if the intersection has a camera,” said Payne, and DeWever agreed. As people who have occasionally run red lights, it is clear that the cameras discourage that for them, which is the ultimate goal.
When interviewed, El Sarraf mentioned that in a rush to arrive at her long-awaited doctor's appointment, she received a ticket, “I honestly did not see the sign…I did not mean to run the red light.” Assuming that if she did see a clear sign, she would have been more cautious. “The ticket cost about $300,” said El Sarraf, “So now I just avoid that intersection as a whole.”
Overall, we found that in total, 36 intersections had an increase in violations, 39 decreased, and 3 stayed the same. Although this suggests there has been a drop in total violations, it has actually increased by 3161 in total, meaning the areas that have increased have on average changed more than the areas that decreased. We think our data could be used to improve city roads and address certain safety issues that affect pedestrians and drivers, especially if it is used in tandem with other data about information such as speed cameras, light durations, and surveys from local residents.
Flashing Red Light [Photograph]. Way Blog. https://www.way.com/blog/flashing-red-light/
Klassen, S. Huang, K. El Haddad, L. (2023). Datawrapper. https://datawrapper.dwcdn.net/SUSxH/5/
Klassen, S. Huang, K. El Haddad, L. (2023). Datawrapper. https://datawrapper.dwcdn.net/x9vP7/3/
Klassen, S. Huang, K. El Haddad, L. (2023). Google My Maps. https://www.google.com/maps/d/u/5/embed?mid=1TSr9j1adJDhwD1HuizYbwrde_gMikKk&ehbc=2E312F
Open Ottawa. Open Ottawa. (n.d.). https://open.ottawa.ca/
Pringle, J. (2023, November 13). Ottawa’s red light cameras issue $14 million in fines in 9 months. Ottawa. https://ottawa.ctvnews.ca/ottawa-s-red-light-cameras-issue-14-million-in-fines-in-9-months-1.6642074
Red Light Camera Violations 2022. Open Ottawa. (2023a, March 31). https://open.ottawa.ca/datasets/ottawa::red-light-camera-violations-2022/explore?location=45.376546%2C-75.754831%2C2.63
Red Light Camera Violations 2023. Open Ottawa. (2023b, September 5). https://open.ottawa.ca/datasets/ottawa::red-light-camera-violations-2023/explore